| Panel |
|---|
| borderColor | green |
|---|
| borderWidth | 1 |
|---|
| titleBGColor | #ddffcc |
|---|
| borderStyle | solid |
|---|
| title | Definition |
|---|
|
Chart (เรียกอย่างเป็นทางการว่า (Formally known as SQL Chart) allows you to define your own SQL query to determine the charts that you would like to generate, ranging from a number of graph types.ช่วยให้คุณสามารถกำหนด SQL Query ของคุณเองเพื่อกำหนดแผนภูมิที่คุณต้องการสร้าง ตั้งแต่จำนวนของกราฟชนิดต่าง ๆ |

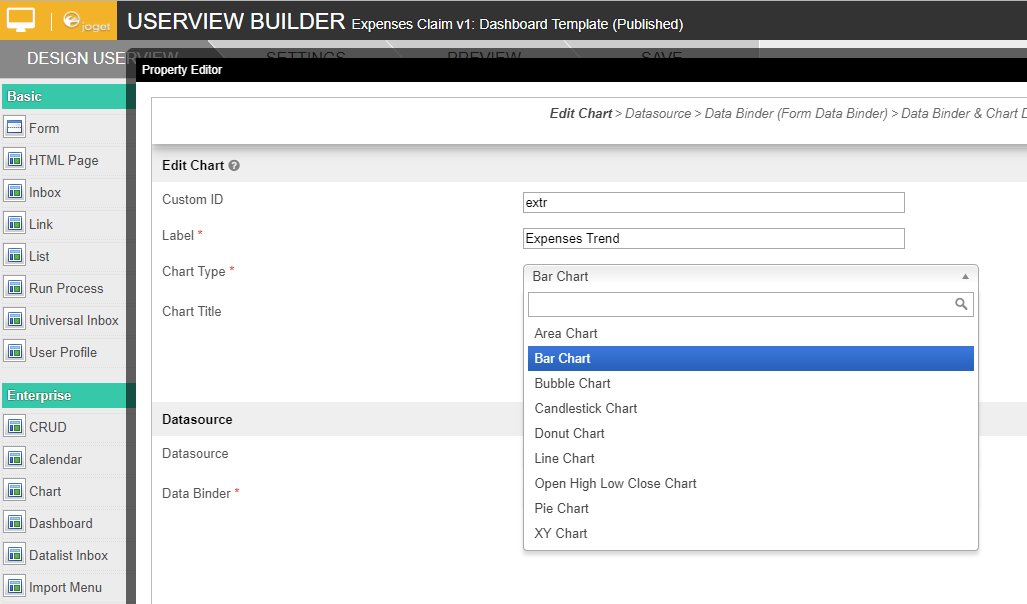
Figure รูปที่ 1: SQL Chart Properties
NameDescription Optional field.Value defined here must be unique to the rest of the Userview Menus as the first matching name will be called upon. |
ตัวแปลที่กำหนดจะต้องไม่ซ้ำกันกับส่วนอื่นของ Userview เนื่องจากจะทำการเรียกใช้ซ้ำ |
|
| Label | ชื่อเมนู ฟิลด์บังคับ |
Label | Menu label. Mandatory field. |
| Chart Type | แผนภูมิพื้นที่ (Area Chart) แผนภูมิแท่ง (Bar Chart) แผนภูมิฟอง (Bubble Chart) แผนภูมิแท่ง (Candlestick Chart) แผนภูมิโดนัท (Donut Chart) แผนภูมิเส้น (Line Chart)
|
Open High Low Close Chart Chart) แผนภูมิวงกลม (Pie Chart) แผนภูมิ XY (XY Chart)
|
| Chart Title |
Chart Title to be displayed part of the generated graph.ชื่อแผนภูมิที่จะแสดงส่วนของกราฟที่สร้างขึ้น | Panel |
|---|
| borderColor | purple |
|---|
| borderWidth | 1 |
|---|
| titleBGColor | #ddccff |
|---|
| borderStyle | solid |
|---|
| title | New Feature |
|---|
|
|
This feature has been enhanced in คุณลักษณะนี้ได้รับการปรับปรุงใน Joget Workflow v6 |
|
to support join, group and aggregate function. เพื่อสนับสนุนการเข้าร่วม กลุ่ม และฟังก์ชันการรวม |
|

Figure รูปที่ 2: SQL Chart Properties - Datasource
NameDescription| คำอธิบาย |
|---|
| Datasource | การใช้ข้อมูล Binder (Using Data Binder) แหล่งข้อมูลเริ่มต้น (Default Datasource) แหล่งข้อมูลที่กำหนดเอง (Custom Datasource)
| Panel |
|---|
| borderColor | purple |
|---|
| borderWidth | 1 |
|---|
| titleBGColor | #ddccff |
|---|
| borderStyle | solid |
|---|
| title | New Feature |
|---|
|
|
New feature in คุณลักษณะใหม่ใน Joget Workflow |
|
for more flexible ways to build chart dataset using the existing Datalist Binders. สำหรับวิธีที่นี้จะยืดหยุ่นมากขึ้นในการสร้างชุดข้อมูลแผนภูมิโดยใช้ Datalist ที่มีอยู่ |
|
| Data Binder |
When Datasource is set to เมื่อมีการตั้งค่าแหล่งข้อมูลเป็น " Using Data Binder" |
, this option will show up.Please see for available binder to use. สำหรับใช้งานตัวผูกมัดที่มีอยู่ |
| SQL Query |
When Datasource is set to use any of the "Datasource", this option will show up.
SQL Query to produce the dataset required for the graph type.
| Info |
|---|
The first column in the dataset will be assumed for X-axis/label. |
The first column to be returned from the query must be a label (X-axis), followed by value columns for the Y-axis.เมื่อชุดข้อมูลถูกตั้งค่าให้ใช้ "แหล่งข้อมูล" ใด ๆ ตัวเลือกนี้จะปรากฏขึ้น SQL Query เพื่อสร้างชุดข้อมูลที่จำเป็นสำหรับชนิดของกราฟ | Info |
|---|
คอลัมน์แรกในชุดข้อมูลจะสันนิษฐานเป็นแกน X /label |
คอลัมน์แรกจะถูกส่งกลับจาก query ต้องเป็น label (แกน X) ตามด้วยคอลัมน์ค่าของแกน Y Example 1: | Code Block |
|---|
| SELECT c_status as 'status', COUNT(c_status) as 'count' FROM app_fd_tix_tickets WHERE c_status IS NOT NULL GROUP BY c_status |
 Image Modified Image Modified
Example 2: | Code Block |
|---|
| select c.c_claimant, sum( cast( replace(c.c_total,'$', '') as decimal(10,2)) ) as 'total', avg( cast( replace(c.c_total,'$', '') as decimal(10,2)) ) as 'avg' from app_fd_hr_expense_claim c group by c.c_claimant
|
 Image Modified Image Modified
 Image Modified Image Modified |

Figure รูปที่ 3: SQL Chart Properties - Data Binder & Chart Data Mapping (applicable for - using การใช้สำหรับ Data Binder)
NameDescriptionColumn to be sorted in the graph dataset. This would affect how the graph is plotted.| คอลัมน์ที่จะเรียงลำดับในชุดข้อมูลกราฟ ซึ่งจะส่งผลต่อวิธีการพล็อตกราฟ |
| Order | |
X-axis Value |
X-axis label. ชื่อแกน X |
Y-axis Values | ชุดข้อมูลแกน Y |
-axis dataset. 
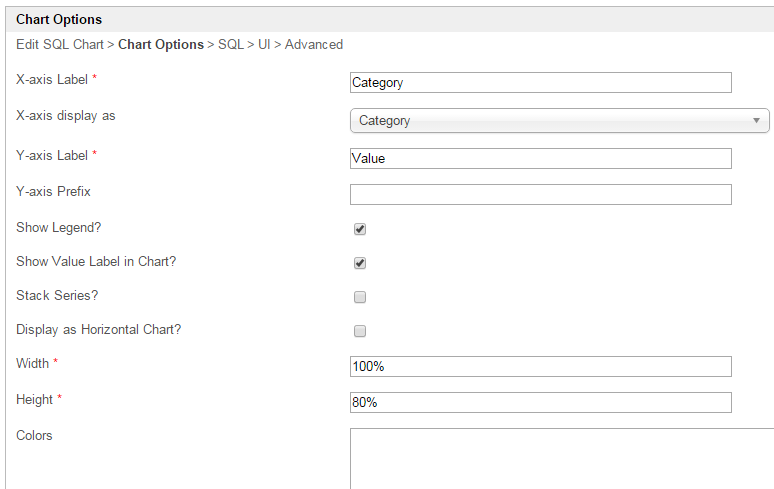
Figure รูปที่ 4: SQL Chart Properties - Chart Options (applicable for - using ใช้สำหรับ Datasource)
NameDescription| คำอธิบาย |
|---|
X-axis Label | ชื่อแกน X |
-axis Label |
X-axis display as | ประเภท (Category) ตัวเลข (Number) วันที่ (Date)
|
Y-axis Label | ชื่อแกน Y |
-axis Label |
Y-axis Prefix | คำนำหน้าแกน Y |
-axis PrefixIf checked, legend will be shown in the generated graph.| ถ้าเลือกไว้จะมีการแสดงคำอธิบายแผนภูมิในกราฟที่สร้างขึ้น |
Show Value Label in Chart? |
If checked, value label will be shown in the generated graph.| ถ้าเลือกไว้จะมีการแสดงป้ายชื่อค่าในกราฟที่สร้างขึ้น |
|
If checked, this will affect the generated graph.| ถ้าเลือกไว้จะมีผลต่อกราฟที่สร้างขึ้น |
Display as Horizontal Chart? |
Display as Horizontal Chart.| แสดงเป็นแผนภูมิแนวนอน |
| Width |
Width in character.Height in character.Series color. Optional field.
Comma separated values สีของชุดข้อมูล ฟิลด์ตัวเลือก ค่าที่คั่นด้วยเครื่องหมายจุลภาค (CSV) |
of color codes. ของรหัสสี Example: | Code Block |
|---|
| #3333FF,#66FF00,#FF9933,#990000 |
 Image Modified Image Modified
| Code Block |
|---|
| red,orange,yellow,green,blue,indigo |
 Image Modified Image Modified
|

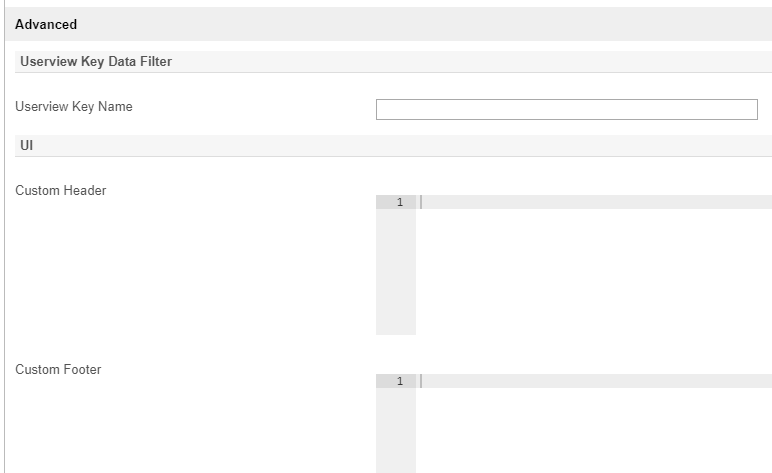
Figure รูปที่ 5: SQL Chart Properties - Advanced
| Name | Description |
|---|
Userview Key Name |
When defined, additional condition will be appended using the value defined here as the parameter and the userview key value as the value.เมื่อกำหนดเงื่อนไขเพิ่มเติมจะถูกผนวกโดยใช้ค่าที่กำหนดไว้เป็นพารามิเตอร์และค่าคีย์ของ Userview | Info |
|---|
| SQL: SELECT category, count(category) FROM table1 Userview Key Name: type Userview Key Value: val Resultant SQL: SELECT category, count(category) FROM table1 WHERE type = 'val' |
|
When userview key value is defined, you may define #userviewKey# in your SQL query to have it replaced with the userview key value.เมื่อมีการกำหนดค่าคีย์ Userview คุณอาจกำหนด #userviewKey# ใน SQL Query ของคุณเพื่อให้แทนที่ด้วยค่าคีย์ Userview | Info |
|---|
| SQL: SELECT category, count(category) FROM table1 WHERE type = '#userviewKey#' Userview Key Value: val Resultant SQL: SELECT category, count(category) FROM table1 WHERE type = 'val' |
|
|
Custom Header in | ส่วนหัวที่กำหนดเองใน HTML |
.Custom Footer in | ส่วนท้ายแบบกำหนดเองใน HTML |
.Interactive Chart
แผนภูมิอินเตอร์แอคทีบ
โค้ดต่อไปนี้สามารถแก้ไขและใส่ใน The following code can be modified and put in " Custom Footer" for interactive Chart.สำหรับแผนภูมิอินเตอร์แอคทีบ
| Code Block |
|---|
<script>
$(document).ready(function(){
    $('#jq_plot_chart').bind('jqplotDataClick',
        function (event, seriesIndex, pointIndex, data) {
            console.log(event);
            console.log(seriesIndex);
            console.log(pointIndex);
            console.log(data);

            //for chart which used legend and x-axis,
            var xaxis = $(".jqplot-xaxis-tick:eq("+pointIndex+")");
            var series = $(".jqplot-table-legend-label:eq("+seriesIndex+")");

            console.log("x-axis :" + xaxis.text());
            console.log("series :" + series.text());
        }
    );

    //for double click event. Please note the arguments are different.
    $('#jq_plot_chart').bind('jqplotDblClick',
        function (event, coordinate, points, data) {
            console.log(event);
            console.log(coordinate);
            console.log(points);
            console.log(data);

            if (data) {
                var xaxis = $(".jqplot-xaxis-tick:eq("+data.pointIndex+")");
                var series = $(".jqplot-table-legend-label:eq("+data.seriesIndex+")");

                console.log("values :" + data.data);
                console.log("x-axis :" + xaxis.text());
                console.log("series :" + series.text());
            }
        }
    );
});
</script> |
| Note |
|---|
This code does not work with OHLC and candlestick chart.โค้ดนี้ไม่ทำงานกับ OHLC และแผนภูมิแท่ง |
| Panel |
|---|
| borderColor | purple |
|---|
| borderWidth | 1 |
|---|
| titleBGColor | #ddccff |
|---|
| borderStyle | solid |
|---|
| title | Performance |
|---|
|
คุณสามารถกำหนดค่าการตั้งค่าประสิทธิภาพใน Userview Element ซึ่งช่วยให้สามารถแคชเนื้อหาที่มีอยู่เพื่อปรับปรุงประสิทธิภาพและความเร็วในการโหลดได้ อ่านเพิ่มเติมที่ You can configure the Performance settings in this Userview Element which allows one to cache existing content for improved performance and loading speed. Read more at Performance Improvement with Userview Caching. |


